

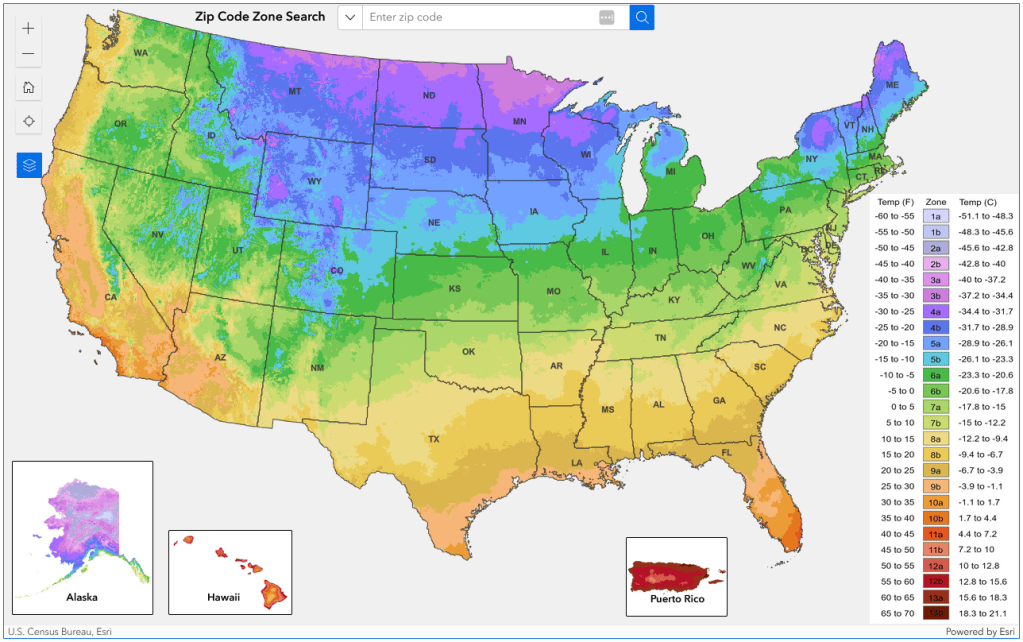
The USDA Plant Hardiness Zone Map has been updated after over 10 years. This new version is based on 30 years of climate data, drawn from over 13,400 weather stations (5,400 more stations than the previous version). You can quickly determine the hardiness zone of any location using its zip code.
The zones for most parts of Texas are now about a half zone lower. So for example, many areas previously listed as 8b are now 9a. Some of this shift reflects the much greater specificity of data because of many more weather stations. This means your zone is likely based on a station much closer to your location than with the previous zone map from 2012.
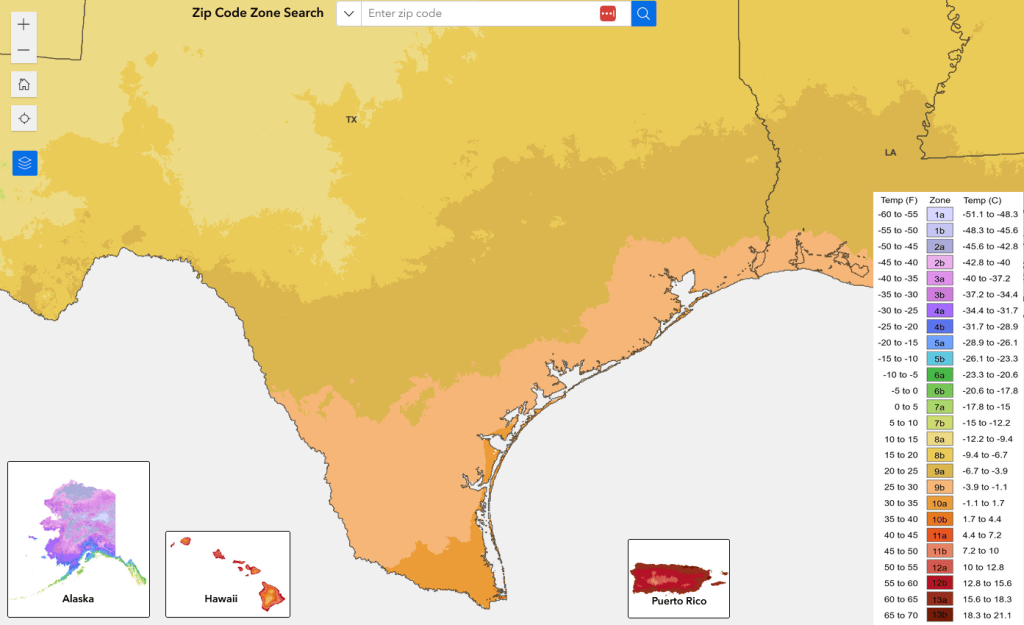
Note that this map is based only on the average lowest winter temperature in each location and has nothing to do with heat or the other climate factors that affect plant growth. So for example, most of the KTRH 740 am GardenLine listening area is in zones 9a & 9B…but so are areas on the western coast of the state of Washington!
This map is useful in choosing plants based on their cold hardiness, but beware choosing a plant based on its hardiness zone alone! Not all zone 9’s are equal, to say the least! Also remember that the zone is based on the average of the lowest cold temperature for the past 30 years in a location.
We all know how widely winter cold and summer heat extremes can vary from year to year. So be ready to protect a marginally hardy plant in winter, despite it being listed for your zone.
Link to view the online map: https://planthardiness.ars.usda.gov/
